Zend Executable Debugger Eclipse Plugin
UPDATE (5 Jan, 21:00): Patrick Mueller has just posted some links to information about XDebug support for PDT. Now, for those not wishing to use the Zend Debugger, you may now use XDebug.
Since I last wrote about the Eclipse PHP IDE a few weeks ago, the Eclipse team has changed the name of the project to the PHP Development Tool, or PDT. So, if you’ve been looking for the PHP IDE, you can find it in the same place, but the name has changed. The name change isn’t what I wanted to write about, though. Rather, I wanted to take a moment to talk about the free Zend Executable Debugger plug-in for Eclipse.
The Zend Executable Debugger plug-in is part of the all-in-one PDT package, but if you want to install it on your own—since it’s possible to use this debugger without the PDT and with PHPEclipse, for example—then you’ll need to install it using the Eclipse Update Manager (the easier way).
To install the Zend Executable Debugger plug-in using the Update Manager, follow the instructions I provided earlier to set up a new update site using the following information:
- PHP Development Tool (PDT)
UPDATE URL:http://downloads.zend.com/pdt
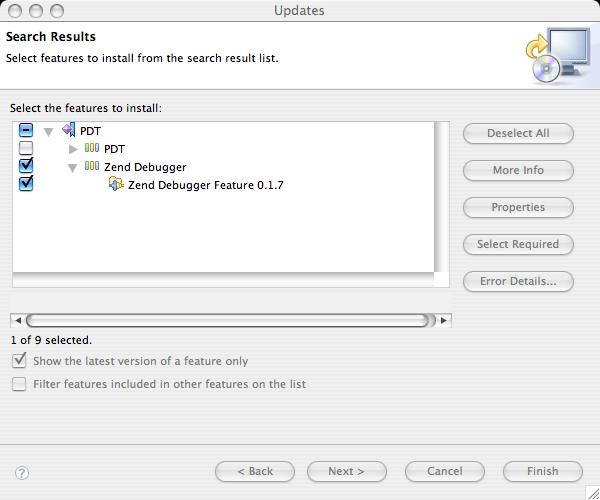
Please note that the Zend Executable Debugger is not available from the Eclipse site’s PHP update URL listed in my earlier post. Instead, you must use the Zend update URL (listed here) to install the debugger. When installing, if you already have the PDT installed, simply choose to install only the Zend Debugger.
Once installed, you can debug a PHP script by selecting the script and choosing Run > Debug As > PHP Script, and that’s all there is to it. The debugging output appears in the console tab, shown here:

23 Comments
Dave Kelsey (IBM) also just posted some plugins for the PDT that allow you to run with XDebug as your debug extension:
Bug 169408
Could you make a tutorial for debugging whole PHP website i ahve trouble with this all.. troubles to configure.
Has anyone tried to do remote debugging yet ?
We have a couple of developers here using Eclipse on Linux and OS X. Local debugging is no problem, but we have to run debug sessions on our development server. Is that possible with PDT + Zend Debugger ?
Has anyone tried to do remote debugging yet ?
We have a couple of developers here using Eclipse on Linux and OS X. Local debugging is no problem, but we have to run debug sessions on our development server. Is that possible with PDT + Zend Debugger ?
Although you probably already know, I figure this couldn't hurt the curious.
I've got it working on 5.2.1, Eclipse 3.2, pdt, and Apache 2.2.
First, DL the remote debugger. You do not need the whole 'Platform' package, just the debugger.
Put the correct 'ZendDebugger.dll' for your php installation in your php directory. Next, open up your php .ini and add these lines to the very bottom:
[DEBUGGER]
zend_extension_ts=C:\php\ZendDebugger.dll
zend_debugger.allow_hosts=127.0.0.1/192.168.1.100
zend_debugger.expose_remotely=always
Of course your ip addresses will vary. Restart server. A quick check of phpinfo() should show:
Zend Technologies with Zend Debugger v5.2.3, Copyright (c) 1999-2006, by Zend Technologies
In the top part.
Now open Eclipse and set up your debugger to talk to the remote server. Click the debug button, then PHP Script. click new config and make sure to set the 'Runtime PHP Executable' to your remote php folder. Now select the php file to debug and off you go.
Hello,
I installed the Eclipse All in One Package from Zend but my Debugger doesn't accept any Extensions. For example i use the mysql Extension in my Projects, but the debugger always says "unknown Procedure". It would be great if s.b. could tell me how to solve this problem!
With friendly Greetings
Rene
//// For example i use the mysql Extension in my Projects,
//// but the debugger always says “unknown Procedureâ€.
Exactly it says:
Debug Error: SQLConnection.inc line 76 - Call to undefined function mysql_pconnect()
WFG Rene
Has anyone resolved the Debug Error Message?
Hello,
I managed to solve the issue with the debugger not being able to call mysql_pconnect() functions.
One thing i didn't realize was that PDT is being setup to call a Plugin library containing PHP4 and PHP5 exe and associated libs within Eclipse.
I had followed the instructions about copying ZendDebugger.dll as stated in this article and defining my php.ini to point to the dll. However, having different versions of the executables and libraries made things messy.
All this to say that i did the following:
1) I went into the Eclipse/plugin folder and looked for the following folder -> org.zend.php.debug.debugger.win32.x86_5.2.6.v20070507
(check your version. I downloaded the "All in one Package" from the Zend website http://zend.com/pdt (I downloaded for my windows version the May 24 08:26 timestamped version)
2)Since i setup my workstation to use PHP5 and MySQL 5, I copied the files from org.zend.php.debug.debugger.win32.x86_5.2.6.v20070507/php5 folder to my actual PHP5 install directory, overwriting my existing files there.
(Please note that i verified my version of the php.exe to be the same as the one defined in the plugins library. Namely, 5.2.2. You can do this by right-clicking your php.exe file and selecting properties and then selecting "version" tab.)
3)in Eclipse preferences under PHP, I made new entries for my PHP executable, pointing to my actual php5 installed folder (f:\php5). I also made sure that my php server pointed to my project url. ie http://localhost/php_project
4)i setup a debug configuration using my newly defined settings and I ran the debug.
I didn't have any problems after doing this. I hope this has helped you somewhat.
thanks
Leo.
Just in, case keep in mind the following:
My setup:
PHP 5.2.2
MySQL Server version: 5.0.41-community-nt MySQL Community Edition (GPL)
Apache 2.2.4
Hello,
when I last posted here, I was still trying to figure out how to get the debug working.
I managed to finally get it done and it was done by a well written document found at the following link:
http://www.thierryb.net/pdt...
One thing I'd like to mention is that for my apache conf settings, I had configured my documentroot within a VirtualHost definition. I had also defined several Aliases for each website I wanted to access. This was causing problems for me with my remote debugging. Make sure any website you want to debug resides under your documentroot directory.
I had installed PDT from eclipse site and also installed Zend debugger plug-in for eclipse from Zend site. But I could not make debugger work for web pages. It worked fine for PHP scripts though. I did lot of googling to find out how to make debugger working for PHP web pages and even after trying several combinations, it did not work for me even after I made following changes to my PHP.INI file.
[Zend]
zend_extension_ts = "C:\xampp\php\ext\ZendDebugger.dll"
zend_debugger.allow_hosts=127.0.0.1/32, 192.168.0.0/255.255.0.0
zend_debugger.expose_remotely=always
My problem was that I was not even able to see Zend Debugger info in phpinfo(); output.
I noticed that people were complaining same problem on Zend forums where they did not see Zend Debugger info on phpinfo(). But I did not find an answer how to fix this and I gave up. I had to also enable LDAP support for PHP and after uncommenting
extension=php_ldap.dll
I did not see the LDAP support in phpinfo() output and this made me wary that I am doing something wrong. My simple LDAP test program worked fine from command line but not from webpage.
I was finally able to solve this problem by an accident. This problem is faced by people who use XAMPP to install the bundle of apache, PHP, Perl, MySQL etc.
I did not know that XAMPP keeps several copies of php.ini. One of them was in C:\XAMPP\apache\bin and another was in C:\XAMPP\php. I was making changes to php.ini in C:\XAMPP\php whereas apache web server was loading this file from C:\XAMPP\apache\bin directory. I read couple of places that make sure that you make changes to php.ini file at the location specified in phpinfo() output but due to the being confidant in nature, I was totally blindsided since I thought that I was making changes at the right place. After wasting 4 hours, I was finally able to use Zend Debugger with Eclipse PDT. What a relief it was at the expense of wasting 4 hours.
Vikram
I am experiencing the same mysql_connect() issue but I am using the "PHP Script" debug method. Everyone else here seems to be using the "PHP Web Page" method. I tried copying the php.ini settings recommended above to the php.ini file in
eclipse\plugins\org.zend.php.debug.debugger.win32.x86_5.2.10.v20070905
It still doesn't work though. Anyone got any ideas on how to make this work?
Thanks!
Easy fix to get rid of the "mysql_connnect not found" issue in eclipse.
This assumes you have PHP installed and have the php_mysql.dll in your extension directory.
1. Rename eclipse\plugins\org.zend.php.debug.debugger.win32.x86_5.2.10.v20070905\php5\php.ini to something like php.ini.old
2. Copy the contents of your php.ini file from your PHP install into:
eclipse\plugins\org.zend.php.debug.debugger.win32.x86_5.2.10.v20070905\php5.
3. Check to make sure ZenDebugger.dll is in the directory.
4. Then add this line at the bottom of the recently copied ini folder: zend_extension_ts=.\ZendDebugger.dll
Ok, now eclipse will lauch the zend php engine using the settings from your traditional php install--inculding the php_mysql.dll.
I also spent several hours searching for the solution of PHP Web page debugging.
The easiest solution is to use latest PDT plugin. It has a new select box option of Zend XDebug.
If you download the lastest version of XAMPP version 1.6.4, there is already entries regarding XDebug but commented.
If you installed your XAMPP in C:/xampp, open C:/xampp/apache/bin/php.ini and update as below.
[Zend]
;zend_extension_ts = "C:\xampp\php\zendOptimizer\lib\ZendExtensionManager.dll"
;zend_extension_manager.optimizer_ts = "C:\xampp\php\zendOptimizer\lib\Optimizer"
;zend_optimizer.enable_loader = 0
;zend_optimizer.optimization_level=15
;zend_optimizer.license_path =
; Local Variables:
; tab-width: 4
; End:
[XDebug]
; Only Zend OR (!) XDebug
zend_extension_ts="C:\xampp\php\ext\php_xdebug.dll"
xdebug.remote_enable=true
xdebug.remote_host=127.0.0.1
xdebug.remote_port=9000
;xdebug.remote_handler=dbgp
;xdebug.profiler_enable=1
;xdebug.profiler_output_dir="C:\xampp\tmp"
Note that you need to disable the Zend Optimizer when the xdebug is enabled or your apache will not start properly
Good Luck
I have installed the debugger and am simply trying to debug a web page but get the following error. Somebody please help, I have been looking at this for days.
CGI Error
The specified CGI application misbehaved by not returning a complete set of HTTP headers. The headers it did return are:
X-Powered-By: PHP/5.2.4
Set-Cookie: ZDEDebuggerPresent=php,phtml,php3; path=/
Set-Cookie: ZendDebuggerCookie=192.168.0.2%2C127.0.0.1%3A10000%3A0||004|77742D65|1033; path=/
Hello,
I get the same error message in my browser. Debugging works fine but the browser stops with this error and does not continue working, though the complete html file content was sent to it. I used a traffic analyser and found two characters (hex code "00") behind "path=/ where the browser stops interpretating the headers. Anyone an idea what causes this error?
s.w.
Hello,
I have managed to get Php debugging working, kind of...
I get the debug info in the phpinfo and I have managed to setup a new project.
The problem I have is that eclipse seems to ignore breakpoints.
I have set to automatically stop at beginning of file in the server config but any other breakpoints are set manually are being ignored.
e.g.: Launch the index.php - Auto breakpoint stops at start.
Stick a breakpoint at the call to Page_Footer() method and it is just ignored.
Anybody encountered this issue?
I was finally able to get Zend Studio Eclipse to stop at my breakpoints. The instructions are here.
After these changes, I can see the zend debugger initiated in phpinfo().
But then the Apache crashes. And the output converts to junk also. :(
Writing debug messages from PHP script into the Console view would be really nice. Apparently this feature is not implemented yet.
On a related note, I was able to get remote "CLI" script debugging working with Eclipse and xdebug...
Hi, I followed the instructions here: http://www.thierryb.net/pdt...
But I get this error when starting Apache:
The requested opperation has failed!
When i change php.ini line:
zend_extension_ts = c:\php5\ext\ZendDebugger.dll
to
zend_extension = c:\php5\ext\ZendDebugger.dll
Apache starts but now when I click Test Debugger in Eclips I get:
A timeout occurred when the debug server attemted to connect....
Im using PDT 2.0 downloaded as a complete package.
PHP 5.1.2 Apache 2.0.55 on win32
Ive double checked the instructions and then double checked again but can't get past this point. Any ideas? Thanks for your time.
Many thanks to ray plante: I have changed the php.ini in XAMPP as he describes in his post and promptly got my output as a cachegrid-file. Then I installed the free program winchachegrid and now I can really see the bottlenecks in my scripts!
hi,
I try zenddebugger with PHP4 and Eclipse PDT the debugger seems to work correctly but I have this error do you have any solution ?
tks in advance
pat
CGI Error
The specified CGI application misbehaved by not returning a complete set of HTTP headers. The headers it did return are:
X-Powered-By: PHP/4.4.9
Set-Cookie: ZDEDebuggerPresent=php,phtml,php3; path=/
Set-Cookie: ZendDebuggerCookie=127.0.0.1%3A10000%3A0||00C|77742D65|1000; path=/